An ICT breaker block is a Smart Money Concepts price structure where a failed order block flips from support to resistance or from resistance to support after a decisive market structure break. In the ICT methodology developed by Michael Huddleston, a breaker block forms when price invalidates an institutional order block, signaling that the previous institutional order flow has been absorbed by opposing liquidity.
The broken order block becomes a new reaction zone where institutions frequently enter trades in the opposite direction of the original move. Breaker blocks often appear after liquidity sweeps, market structure shifts, and displacement moves, making them a key ICT tool for identifying continuation entries within trending market conditions.
What Exactly is an ICT Breaker Block?
Let us go deeper into the definition. An ICT breaker block forms through a very specific sequence of events. It starts with the formation of a standard order block.
That order block is then violated when price closes beyond its boundaries and takes out the liquidity sitting on the other side. Once that happens, the order block zone has broken, and it is now reclassified as a breaker block.
Here is the sequence laid out clearly:
- A standard bullish or bearish order block forms on the chart.
- Price initially respects the order block and moves in the expected direction.
- At some later point, price reverses, returns to the order block, and closes through it, breaking the high (for a bullish order block) or the low (for a bearish order block).
- The liquidity that was resting beyond the order block, typically the stop losses of traders who entered in the original direction, gets taken out.
- The zone of the old order block now becomes a breaker block with the opposite polarity.
- When price eventually returns to this zone again, it is expected to react in the new direction rather than the original one.
The shift in polarity is the core idea. The zone did not lose its significance when the order block broke. It gained new significance, just with a reversed role. A bullish order block that got broken now acts as a ceiling for price. A bearish order block that got broken now acts as a floor.
If you want to know exactly when the London, New York, Tokyo, and Sydney sessions open in your local time, this Forex Market Hours tool makes it simple and accurate.
What Are the Different Types of ICT Breaker Blocks?
There are two types of breaker blocks, and they mirror the two directions prices can move. Understanding each one will help you identify them quickly on any chart.
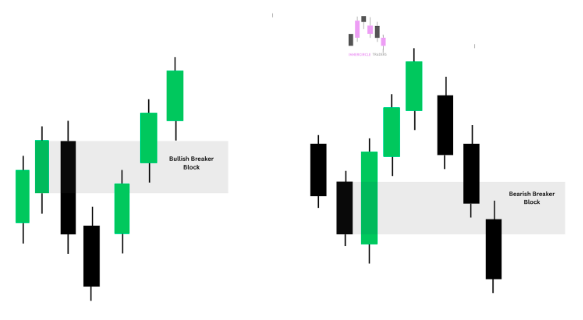
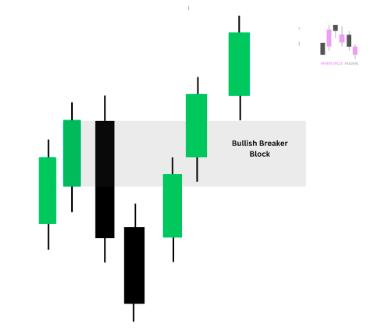
What is a Bullish Breaker Block?
A bullish breaker block forms from a failed bearish order block. Here is how it happens step by step:
- Price is in a downtrend or at a point where a bearish order block formed. The bearish order block is the last bullish candle before the downward move.
- Price drops from that area as expected, then eventually finds a low and starts reversing to the upside.
- The reversal becomes strong enough that price pushes back up through the bearish order block zone, closing above the high of the original bullish candle that defined that zone.
- This breaks the bearish order block and transforms it into a bullish breaker block.
- When price later pulls back down to this zone, the former resistance from the bearish order block now acts as support.
Traders use the bullish breaker block as a buy zone. The entry is taken when price retraces into the zone, with a stop loss placed below the low of the breaker block zone and a target aimed at the next liquidity level above.
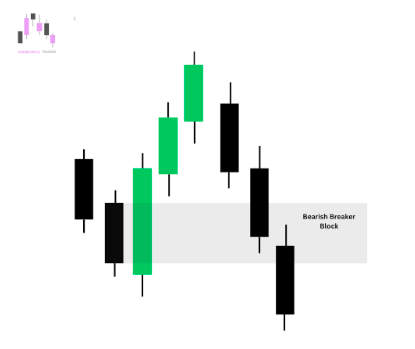
What is a Bearish Breaker Block?
A bearish breaker block forms from a failed bullish order block. The process is the mirror image:
- Price is in an uptrend or at a point where a bullish order block formed. The bullish order block is the last bearish candle before an upward move.
- Price rallies from that area, then eventually peaks and starts declining.
- The decline is strong enough that price pushes back down through the bullish order block zone, closing below the low of the original bearish candle that defined the zone.
- This breaks the bullish order block and turns it into a bearish breaker block.
- When price later retraces back up into this zone, the former support from the bullish order block now acts as resistance.
Traders use the bearish breaker block as a sell zone. Entry is taken on the retracement into the zone, stop loss above the top of the breaker block zone, and target at the next liquidity level below.
What Does a Breaker Block Actually Do in the Market?
There is a logical reason why price tends to react at breaker block zones, and that reason comes down to trader positioning and institutional behavior.
It Traps Retail Traders on the Wrong Side
When a bullish order block forms and retail ICT traders enter long positions at that zone, they place their stop losses below the low of the order block. When price eventually breaks through that zone and takes out those stops, those traders are now long, trapped, and stopped out at a loss. But the damage does not end there.
Some of those traders who got stopped out will now look to re-enter short because the zone has broken. When price comes back up to the zone on a retracement, those same traders may enter short right at the breaker block level, effectively adding to the selling pressure at that area.
It Provides Institutions a High-Quality Re-Entry Zone
Institutions that initiated the move that broke the original order block now have a fresh interest in that zone. When price retraces back into the breaker block area, it gives them an opportunity to add to or re-enter their position at a technically significant level with a logical stop loss area nearby. This combination of institutional re-entry and trapped retail traders exiting creates a powerful reaction zone.
Proper risk management starts with position sizing. This Position Size Calculator helps you calculate the exact lot size based on your risk percentage and stop loss.
It Acts as a PD Array in the ICT Framework
In ICT terminology, a PD Array (Premium and Discount Array) is any price level or zone that has a defined and repeatable effect on price delivery.
Breaker blocks are explicitly listed as PD arrays in the ICT framework. This means they are used by ICT traders when building their daily bias, marking up their charts before a trading session, and deciding where price is likely to go next.
It Confirms a Change in Market Structure
When a breaker block forms, it almost always means market structure has shifted. A bullish order block breaking down confirms a bearish market structure shift. A bearish order block breaking up confirms a bullish structure shift. So the breaker block is not just an entry zone. It is also a structural signal that tells you the previous trend has been compromised and a new directional bias is forming.
How Do You Identify an ICT Breaker Block on a Chart?
Identifying breaker blocks correctly is a skill that requires you to first be comfortable marking order blocks. If you can mark order blocks well, finding breaker blocks is a natural next step. Here is the process:
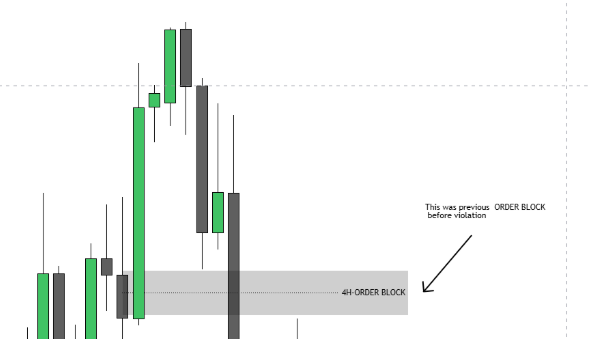
Step 1: Mark All Active Order Blocks
Start by identifying the active bullish and bearish order blocks on your chart within the relevant timeframe. These are your zones to watch. You are not looking for the breaker block itself yet. You are laying the groundwork.
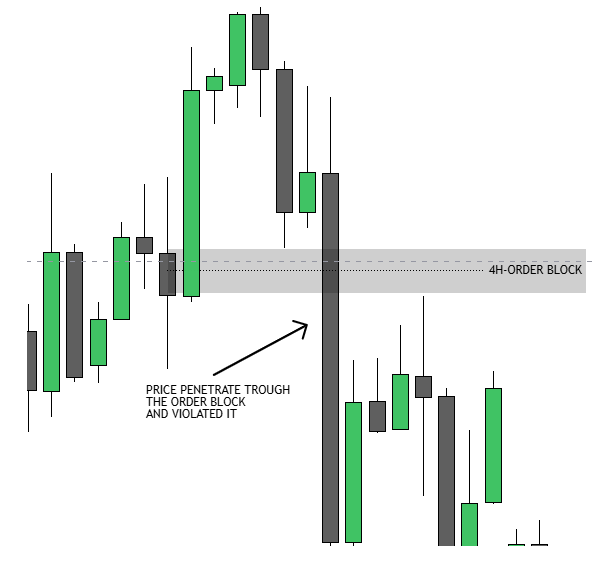
Step 2: Watch for a Violation
A violation occurs when price closes beyond the boundaries of an order block rather than reversing from it. For a bullish order block, the violation is a candle close below the low of the zone. For a bearish order block, the violation is a candle close above the high of the zone. The moment of violation is what triggers the reclassification from order block to breaker block.
Some ICT traders accept a wick through the zone as a violation. Others require a full candle body close beyond the zone. For the most reliable results, requiring a full candle close beyond the zone reduces false signals significantly.
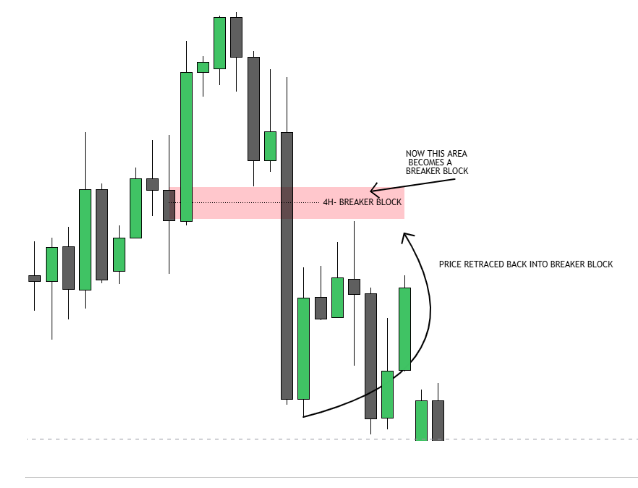
Step 3: Mark the Breaker Block Zone
Once the order block is violated, relabel that zone as a breaker block and mark it clearly on your chart. The zone boundaries remain the same as the original order block.
A bullish order block that broke down becomes a bearish breaker block using the same high-to-low range. A bearish order block that broke up becomes a bullish breaker block using the same range.
Step 4: Wait for the Return
A breaker block is only useful when price comes back to it. After the violation and the subsequent move in the new direction, wait for price to retrace back into the breaker block zone. This retracement is your setup window. Do not enter the trade until the price is actually inside the zone.
How Do You Trade an ICT Breaker Block? Step-by-Step Strategy
Here is a complete trading strategy for both types of breaker blocks. These steps are designed to be followed in sequence for maximum probability.
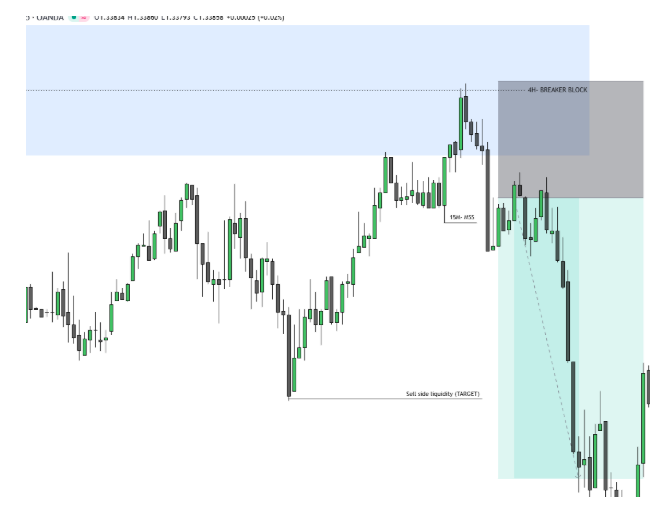
Bearish Breaker Block Trade Setup
- Establish a bearish bias on the higher timeframe, such as the daily or 4-hour chart. Price should be in a downtrend or have recently made a lower high structure.
- Identify a bullish order block that was previously active on the intermediate timeframe, such as the 1-hour or 15-minute chart.
- Watch for price to break below the low of that bullish order block on a candle close. Confirm that the break involved a sweep of the lows below the order block, taking out retail long stop losses.
- After the break, price will continue moving down before eventually pulling back upward. Mark the now-broken bullish order block as a bearish breaker block.
- Wait for price to retrace back up into the bearish breaker block zone.
- On a lower timeframe such as the 5-minute chart, look for a market structure shift to the downside or a bearish displacement candle within the zone. This is your entry trigger.
- Enter short (sell) after the confirmation. Place your stop loss a few pips above the high of the breaker block zone. Target the nearest liquidity pool below, such as a swing low, equal lows, or a higher timeframe demand zone.
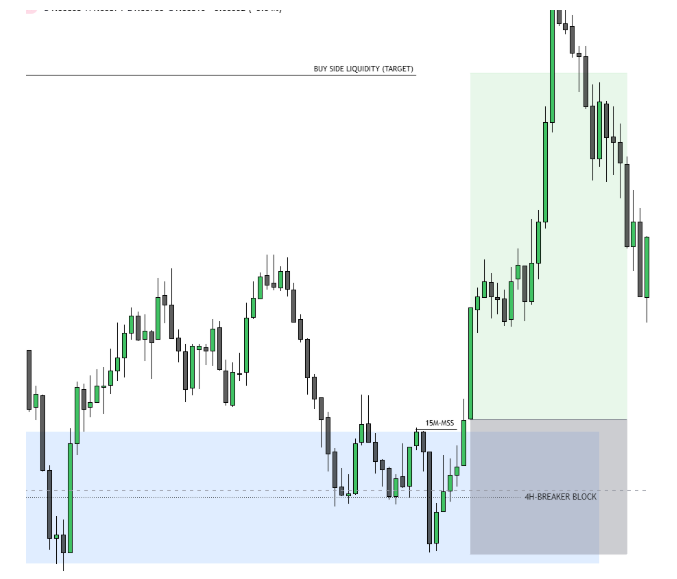
Bullish Breaker Block Trade Setup
- Establish a bullish bias on the higher timeframe. Price should be in an uptrend or have recently formed a higher low structure.
- Identify a bearish order block that was previously active on the intermediate timeframe.
- Watch for price to close above the high of the bearish order block. Confirm that the break took out the liquidity sitting above the zone, such as the stop losses of traders who shorted from that area.
- After the break, price will continue upward before eventually pulling back downward. Mark the now-broken bearish order block as a bullish breaker block.
- Wait for price to retrace back down into the bullish breaker block zone.
- On a lower timeframe, look for a market structure shift to the upside or a bullish displacement candle within the zone.
- Enter long (buy) after confirmation. Stop loss below the low of the breaker block zone. Target the nearest liquidity pool above, such as a swing high, equal highs, or a higher timeframe supply zone.
What is the Difference Between a Breaker Block and an Order Block?
This is one of the most common questions from traders learning ICT, and the answer is important enough to state plainly.
An order block is an active institutional zone that price has not yet returned to and broken through. When price comes back to an order block, the expectation is that it will hold and price will reverse from it in the original direction. An order block represents an area of institutional defense.
A breaker block is a former order block that has already been broken. It has lost its original role and taken on the opposite role. Where the order block was support, the breaker block is now resistance.
Where the order block was resistance, the breaker block is now support. A breaker block represents a zone where the original institutional position has been overwhelmed and a new directional move is underway.
The practical difference for a trader is this: at an order block, you are entering in the same direction as the original institutional move. At a breaker block, you are entering in the opposite direction of the original move, aligning with the new institutional flow that broke the order block in the first place.
Both are valid trade setups. But they are used at very different points in a price cycle and carry different meanings about what institutions are currently doing in the market.
These liquidity pools act as magnets for price, providing clear targets. Before placing any trade, it’s important to understand currency values. This Currency Converter lets you quickly convert currencies using live exchange rates.
What is the Best Timeframe to Trade ICT Breaker Blocks?
Breaker blocks exist across all timeframes, from the monthly chart down to the 1-minute chart. However, not all of them are equally reliable. Here is how to think about timeframe selection:
Higher Timeframe Breaker Blocks Are the Most Powerful
A breaker block that forms on the daily or 4-hour chart carries significant weight because the order block that broke was protecting a large institutional position. When that zone breaks on a daily chart, the shift in sentiment is meaningful and the subsequent reaction when price returns to the zone is usually strong.
Use Lower Timeframes for Entry Execution
Once you identify a daily or 4-hour breaker block zone, drop to the 1-hour, 15-minute, or 5-minute chart to find your precise entry. You are not looking for a new breaker block on these lower timeframes. You are looking for a confirmation signal, such as a small market structure shift or a displacement candle, within the higher timeframe breaker block zone to trigger your entry.
Final Thoughts on ICT Breaker Blocks
The ICT breaker block is one of those concepts that rewards traders who put in the time to understand it deeply. On the surface, it sounds simple: a failed order block becomes a breaker block. But using it effectively requires you to understand market structure, liquidity, institutional positioning, and how all of those elements interact at specific price levels.
The biggest shift in thinking that breaker blocks require is this: just because an order block broke does not mean the area is dead. It means the area has changed its character. Experienced ICT traders do not abandon a zone when it breaks. They relabel it and watch for the next reaction in the opposite direction.
If you are new to this concept, the best way to build confidence is to go back through your charts and identify historical order blocks. Then look at what happened after those zones broke. Mark the breaker blocks and see how the price reacted when it returned to them. That kind of chart study will do more for your understanding than reading about it ever could.
Once you are comfortable with breaker blocks in isolation, start combining them with other ICT concepts: higher timeframe FVGs for targets, kill zone timing for entries, and liquidity sweeps for confirmation. When all of those elements align, you have a genuinely high-probability trade setup that reflects real institutional activity in the market.
Continue building your ICT knowledge by exploring the related concepts on this site, including order blocks, fair value gaps, market structure shifts, and liquidity pool identification. Each concept adds a new layer to your understanding and brings you closer to reading the market the way institutions do.