An ICT Fair Value Gap (FVG) is a three-candle price imbalance pattern in the Inner Circle Trader methodology where price moves aggressively in one direction, leaving an inefficient trading zone between the first and third candles.
The middle candle expands so quickly that buyers and sellers do not transact evenly, creating a liquidity imbalance in the market structure.
ICT traders treat the Fair Value Gap as a price delivery inefficiency that the market often revisits to rebalance order flow. The ICT Fair Value Gap acts as a high-probability entry zone, a retracement target, and a confirmation signal of institutional order flow and algorithmic price delivery within the smart money trading framework.
What Exactly is an ICT Fair Value Gap?
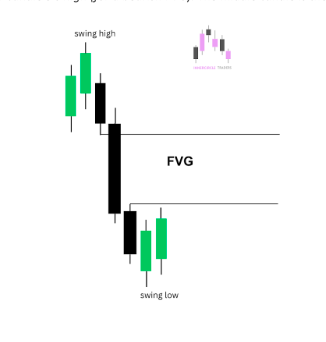
An ICT fair value gap is defined by three consecutive candles where the middle candle is so large and fast that the wicks of the first and third candles do not overlap.
This indicates massive buying or selling pressure as prices could not overlap and become imbalanced .This is also called BISI and SIBI. These gaps are inefficiencies in the price movement.
Prices move by creating buying and selling on every price level but when smart money involves and large orders are triggered, price is displaced with massive pressure which leads to inefficiencies in price .
The gap that exists between the high of the first candle and the low of the third candle is the fair value gap. This zone was never traded from both sides, meaning buyers and sellers did not interact efficiently in that price range during that time.
Think of it this way. When price moves normally, candles overlap each other because buying and selling is happening constantly.
When you get a fair value gap, it means the price moved so quickly and with such force that the overlapping did not happen. That is a sign of institutional involvement, a large player pushing price aggressively in one direction.
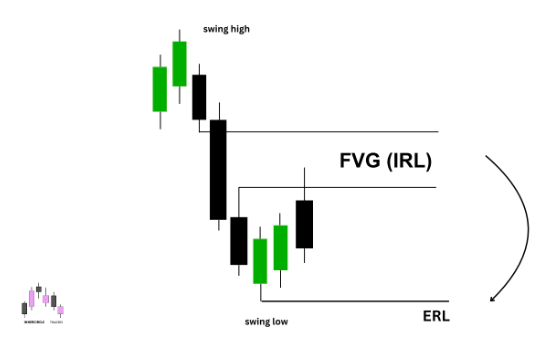
The fair value gap zone is then marked on the chart and watched. When price comes back to that zone on a later candle, that is the retracement into the FVG. This is where ICT traders look to enter trades, because the FVG acts as a magnet pulling price back before the trend continues.
If you want to know exactly when the London, New York, Tokyo, and Sydney sessions open in your local time, this Forex Market Hours tool makes it simple and accurate.
Simple Rule: FVG = the space between Candle 1’s high and Candle 3’s low (for a bullish FVG), or between Candle 1’s low and Candle 3’s high (for a bearish FVG). The middle candle is the displacement candle.
How Does an ICT Fair Value Gap Form on a Chart?
Understanding the formation process makes it much easier to spot FVGs in real time.
Here is what happens step by step:
- Price is moving in a direction and then a strong displacement candle forms. This candle is noticeably larger than the candles around it and moves sharply in one direction.
- The candle before the displacement candle has a high (in a bullish move) or a low (in a bearish move). The candle after the displacement candle opens without retracing back into the body of the previous candle.
- A visible gap forms between the high of the first candle and the low of the third candle. This uncovered space is the fair value gap.
- Price often continues moving in the direction of the displacement for a while before eventually pulling back into the FVG zone.
- When price retraces into the FVG, traders watch for signs of reversal to enter in the original direction of displacement.
The displacement candle is the key ingredient. Without a strong, impulsive middle candle, there is no fair value gap in the ICT sense.
Random, small fluctuations between candles do not qualify. You need to see a candle that stands out visually because of its size and speed relative to the surrounding price action.
What are the Different Types of Fair Value Gaps in ICT?
This is one of the most commonly searched questions about fair value gaps, and it is an important one because ICT has expanded the original FVG concept into several variations over the years. Understanding the different types helps you use the right tool in the right situation.
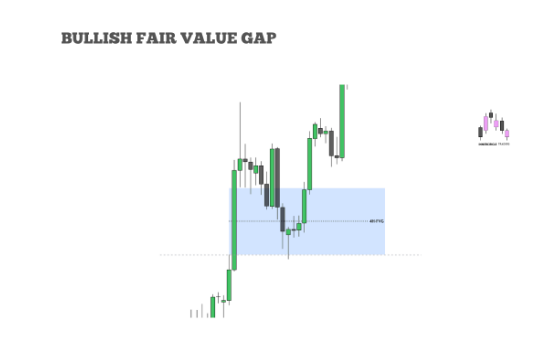
Bullish Fair Value Gap
A bullish fair value gap forms during an upward displacement move. The gap exists between the high of the first candle and the low of the third candle in the three-candle formation.
This zone sits below the current price, and when price retraces back down into it, it often acts as a support area from which price can resume moving upward.
Bullish FVGs are best traded when the higher timeframe trend is also bullish and price is in a discount area, meaning below the midpoint of the most recent swing range. These conditions give you the best probability of the FVG holding as support and price bouncing from it.
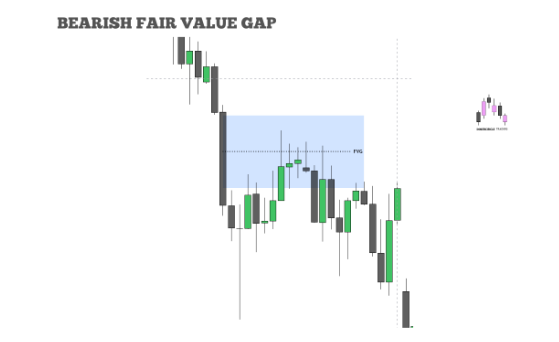
Bearish Fair Value Gap
A bearish fair value gap forms during a downward displacement move. The gap is between the low of the first candle and the high of the third candle.
This zone sits above the current price after the move down, and when price pulls back upward into it, it often acts as resistance before price drops again.
Bearish FVGs are most reliable when the higher timeframe is in a bearish trend and price is in a premium area, meaning above the midpoint of the most recent swing range. Trading bearish FVGs in these conditions increases your win rate significantly.
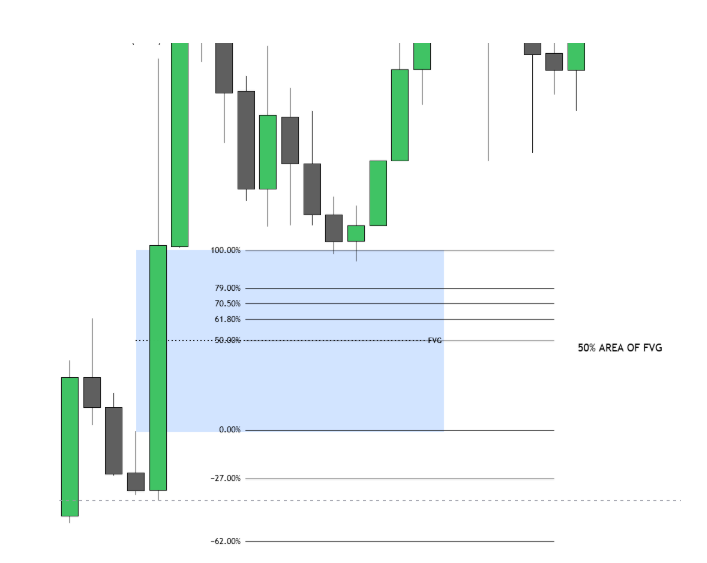
Consequent Encroachment (CE) of the FVG (sensitive area for price )
This is not a separate type of FVG, but rather a level within any FVG that ICT traders use as a precise entry point. The consequent encroachment is simply the 50% midpoint of the fair value gap zone.
ICT theory suggests that price often reaches at least the midpoint of the FVG before finding a reaction. Many traders use this level as their entry trigger or their stop loss reference when trading an FVG.
Higher Time Frame FVG vs Lower Time Frame FVG
Another way traders categorize fair value gaps is by the timeframe they form on. A daily fair value gap carries far more weight than a 5-minute FVG because the displaceme
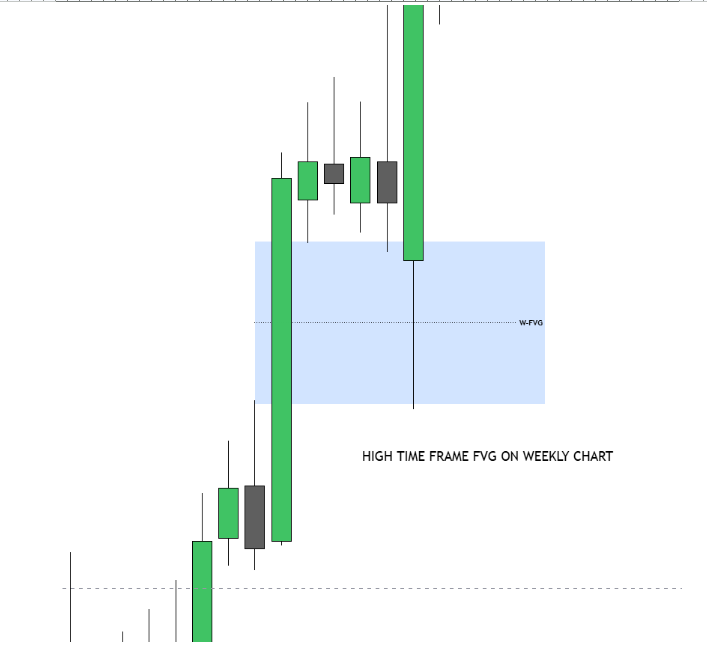
nt that created it involved a much larger volume of institutional orders. As a general rule:
- Monthly and weekly FVGs are the strongest and act as major draw-on-liquidity targets
- Daily FVGs are high-probability trade zones and are used by many ICT traders as their primary setup timeframe
- 4-hour and 1-hour FVGs are useful for trade management and confirming intraday direction
- 15-minute and lower FVGs are precision tools for entry refinement within a zone identified on a higher timeframe
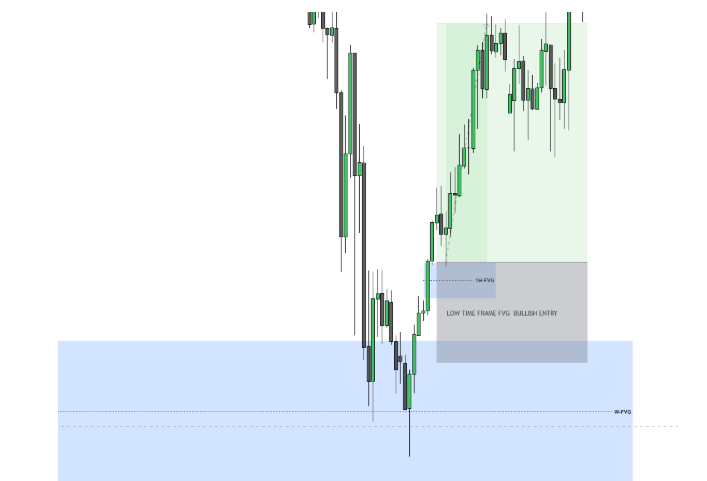
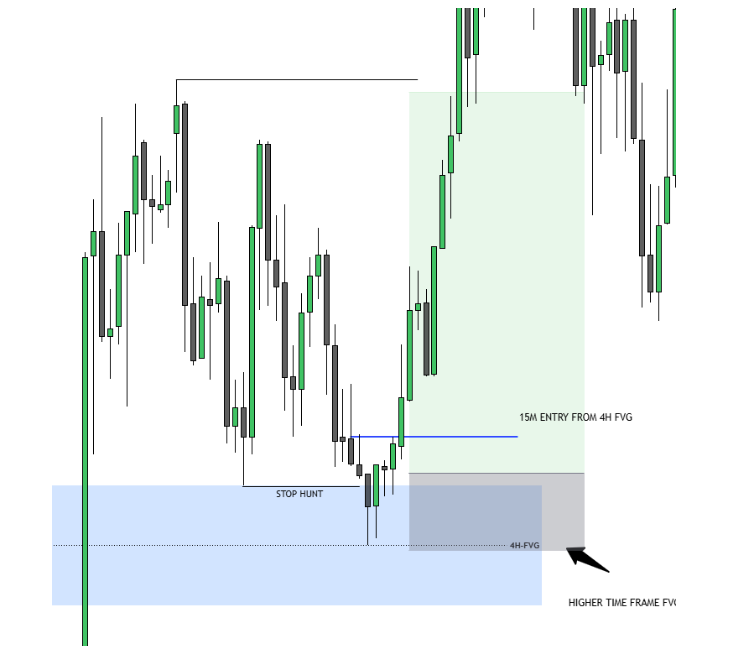
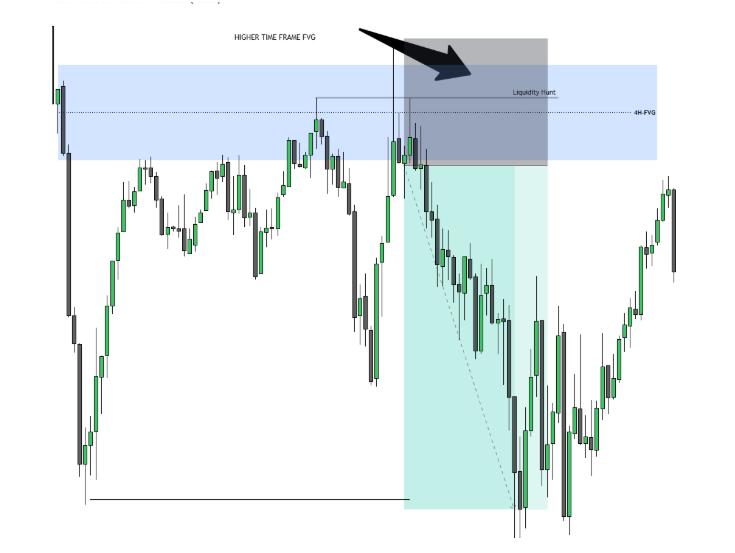
Using a higher timeframe FVG as your target and a lower timeframe FVG as your entry trigger is a common and effective ICT approach.
How Do You Identify an ICT Fair Value Gap on a Chart?
Spotting an FVG correctly is a skill that improves with practice. Here is a straightforward process to follow:
Step 1: Look for a Strong Displacement Candle
Scroll through your chart and look for a candle that is noticeably larger than the ones around it. It should close well above (for bullish) or well below (for bearish) the surrounding candles. This is your middle candle, the engine of the FVG.
Proper risk management starts with position sizing. This Position Size Calculator helps you calculate the exact lot size based on your risk percentage and stop loss.
Step 2: Check the Candle Before and After
Look at the candle directly before the displacement candle. Note its high (for a bullish move) or its low (for a bearish move). Now look at the candle directly after the displacement candle. Note its low (for a bullish move) or its high (for a bearish move).
Ask yourself: is there a visible space between the high of candle one and the low of candle three? If yes, and if the wicks of those two candles do not overlap into that space, you have a valid ICT fair value gap.
Step 3: Mark the Zone
Draw a rectangle or shaded zone on your chart from the high of the first candle to the low of the third candle (for a bullish FVG). This is your zone. Also note the 50% midpoint of this zone, which is the consequent encroachment level that many traders use as a precision entry point.
Step 4: Confirm the Context
Before considering a trade, confirm the following:
- Is the higher timeframe trend in the same direction as your trade idea? A bullish FVG trade should align with a bullish higher timeframe bias.
- Is price at a premium or discount? Bullish FVGs are more reliable in discount areas. Bearish FVGs are stronger in premium areas.
- Was the displacement candle preceded by a liquidity sweep? An FVG that forms after a sweep of a swing low (for bullish) or swing high (for bearish) is significantly more reliable than one that forms in the middle of a range.
- Is there a clear draw on liquidity above (for bullish) or below (for bearish) that gives price somewhere logical to go after the FVG holds?
How Do You Trade an ICT Fair Value Gap? A Step-by-Step Strategy
Here is a practical trading strategy for both bullish and bearish FVG setups that any ICT student can apply.
Bullish FVG Trade Setup
- Confirm the higher timeframe (daily or 4-hour) is in a bullish structure. Price should be making higher highs and higher lows, or you should be at a major higher timeframe demand area.
- Drop to an intermediate timeframe such as the 1-hour or 15-minute chart. Wait for a clear liquidity sweep below a recent swing low followed by a sharp bullish displacement move.
- Identify the fair value gap created by that displacement. Mark the zone from the high of the first candle to the low of the third candle.
- Wait for the price to pull back into the FVG zone. Do not enter as soon as the zone is created. The whole point is to enter when the price returns to it.
- When price enters the FVG zone, watch for a reaction. On a lower timeframe such as the 5-minute chart, look for a short-term market structure shift to the upside or a bullish displacement within the zone as your entry trigger.
- Enter long (buy). Place your stop loss below the low of the FVG zone. Your target is the nearest liquidity level above, such as a swing high, equal high, or a higher timeframe FVG or order block.
Bearish FVG Trade Setup
- Confirm the higher timeframe is in a bearish structure or at a significant supply area.
- On an intermediate timeframe, wait for a liquidity sweep above a recent swing high followed by a sharp bearish displacement.
- Mark the bearish FVG zone from the low of the first candle to the high of the third candle.
- Wait for the price to pull back up into the FVG zone.
- On a lower timeframe, look for a bearish structure shift or bearish displacement within the zone as your entry trigger.
- Enter short (sell). Stop loss goes above the top of the FVG zone. Target the nearest liquidity level below, such as a swing low or equal low.
What are the Most Common Mistakes When Trading ICT Fair Value Gaps?
Trading FVGs Without Higher Timeframe Confirmation
A fair value gap on a 5-minute chart can and does fail regularly if the higher timeframe is pushing against your trade direction. Always know your higher timeframe bias before trading any FVG. The higher timeframe is your filter. The lower timeframe is your execution tool.
Entering the Moment the FVG Forms
Some traders try to enter a trade the instant the displacement candle closes, before price has even pulled back to the FVG. This is chasing price.
The entire advantage of the FVG concept is that you get to enter at a better price when the market retraces to the imbalance zone. Entering before the pullback removes that edge.
Treating Every Large Candle as an FVG
Not every big candle creates a valid FVG. You need to confirm that the gap actually exists between the high of the first candle and the low of the third candle with no overlap.
Sometimes what looks like a gap at first glance is actually covered by the wicks of the surrounding candles. Always check the actual high and low values carefully.
These liquidity pools act as magnets for price, providing clear targets. Before placing any trade, it’s important to understand currency values. This Currency Converter lets you quickly convert currencies using live exchange rates.
Ignoring Liquidity Context
An FVG that forms without a preceding liquidity sweep is generally much weaker than one that follows a sweep. If price just drifted upward and then formed a gap, without any obvious collection of stop losses or liquidity, the institutional context is questionable. Always prefer FVGs that form after a visible liquidity event.
Quick Reference: ICT Fair Value Gap Cheat Sheet
What is it?
A three-candle formation where the high of candle one and the low of candle three do not overlap, leaving an untraded gap in the middle.
What causes it?
Institutional displacement, a strong, fast move driven by large orders that leaves price imbalanced.
Bullish FVG Zone:
High of candle one to low of candle three (zone sits below current price after the upward move).
Bearish FVG Zone:
Low of candle one to high of candle three (zone sits above current price after the downward move).
Key Level Within the FVG:
Consequent Encroachment (CE) = the 50% midpoint of the zone. Most reliable entry or reaction point.
Best Conditions for Bullish FVG Trade:
- Bullish higher timeframe structure
- Price in a discount area
- FVG formed after a sweep of a swing low
- Clear liquidity target above
Best Conditions for Bearish FVG Trade:
- Bearish higher timeframe structure
- Price in a premium area
- FVG formed after a sweep of a swing high
- Clear liquidity target below
Final Thoughts on the ICT Fair Value Gap
The ICT fair value gap is one of the most useful and widely applicable concepts in the entire ICT methodology. Once you understand that price tends to seek efficiency and fill imbalances, you start seeing FVGs everywhere on your charts, and you begin to use them as a map for where price is likely to go next.
The key to trading FVGs well is not just being able to identify them. It is understanding the context they sit in. A bullish FVG after a liquidity sweep in a discount area during a bullish higher timeframe trend is a very different trade from a random FVG spotted on a 1-minute chart with no context. The context is everything in ICT trading.
Take your time learning to read FVGs on the daily and 4-hour charts first. Once you can confidently identify them, relate them to the surrounding market structure, and understand why they formed, you will be in a much stronger position to drop down to lower timeframes and execute with precision.
For more in-depth ICT education, explore the other articles on this site covering market structure, order blocks, liquidity pools, kill zones, and the ICT power of three. Each concept you add builds on the previous one, and together they give you a complete picture of how institutional markets move.