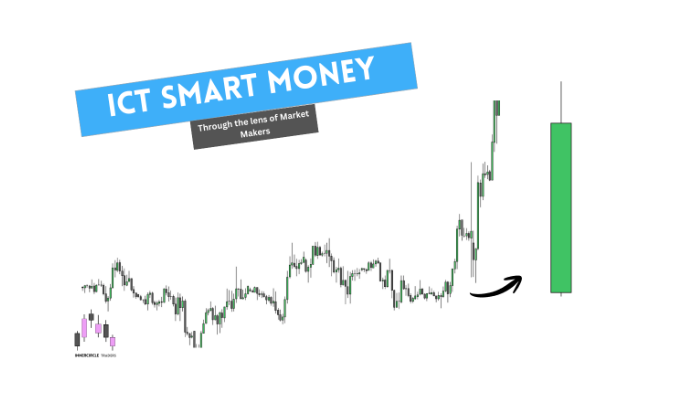
Interbank price delivery Algorithm also called IPDA, named by ICT, controls the price movement in the market.
Since we know price does not move randomly from one point to another but follows a pattern controlled or instructed by Algorithms.
IPDA is a price delivery pattern or sequence market follows.
WHY DO PRICE MOVE?
Prices move in the market from one direction to another for
- Liquidity hunt
- Fills inefficiencies (Fair value gaps)
- Rebalance premium and discount
So IPDA is a sequence given by ICT which states any selling or buying programs starts with
- CONSOLIDATION
- EXPENSION
- RETRACEMENT
- REVERSAL
If you want to know exactly when the London, New York, Tokyo, and Sydney sessions open in your local time, this Forex Market Hours tool makes it simple and accurate.

Any buying or selling program initiates with CONSOLIDATION
What is Consolidation by ICT?
Reference Point in Institutional Order Flow: Equilibrium
Consolidations occur when the price is in a tight range and does not show willingness to go either side or break out yet.
Consolidations is a phase of market in which the Market Makers are building liquidity above
and below the market. For Market Makers or Smart Money liquidity is the core element in the market to move prices and to fulfil their massive orders. We can anticipate Expansions to occur after Consolidation. Be patient and look for a Displacement away from the Equilibrium price point of the Consolidation.
Hint : Mark range high and range low of consolidation and Mark 50% or equilibrium or consolidation wait for expansion, an order block near equilibrium should form.
 GBPUSD CHART
 What is Expansion by ICT?
After consolidation IPDA creates an Expansion. Expansion is when price moves quickly from a level of Equilibrium. This shows a willingness from the Market Makers to reprice to the next objective.
This is a kind of displacement to stop out retailers or to hunt liquidity. If markets start from a Consolidation, a Displacement will be used to break out of the Consolidation.
Price will then print an Order Block whilst breaking out of the Consolidation. The Order Block will be found near or at the Equilibrium of the Consolidation. An Expansion leg should contain FVG’s rapid movement of price with massive trade volume.
Hint : Don’t enter on expansion this may be a trap. Find an OB or FVG inside this expansion leg. Wait for retracement to take an entry from FVG or OB.
Proper risk management starts with position sizing. This Position Size Calculator helps you calculate the exact lot size based on your risk percentage and stop loss.
 GBPUSD CHART
 What is Retracement according to ICT?
After expansion the price does not go straight to target instead it should Retrace. Retracement is when price retraces back within the price range formed by The Displacement.
Retracements inside of a price range seek areas that were not efficiently Traded (Fair value Gaps) . Fair Value Gaps and Imbalances show us areas that were not efficiently traded.
Another reason for retracement is to rebalance the price at equilibrium level or 50% or price range. When thinking of retracements, you should instantly think of Fair Value.
Wait patiently for price to come into an OB or FVG then execute your entries this understanding can save you from TRAP.
Hint : Identify where the traders are getting trapped. Spot the liquidity or become liquidity.
 GBPUSD CHART
 Reversal Explained by ICT
Reference Point in Institutional Order Flow: LiquidityPool
Reversal is when Price completely reverses its current trend established.
Smart Money or Market Makers need orders meaning liquidity to fulfill their orders so they have to trap retail traders by creating fake moves.
Intention is to hunt their stops and reverse the price toward an opposite direction. When price expands after tight consolidation.
Retail traders find it’s a breakout they take positions but IPDA hunt their stops and reverses the move towards an opposite direction.
Reversals occur at Liquidity Pools. Bullish Liquidity Pools are found under old lows. Bearish Liquidity Pools are found above old highs.
Hint: Don’t take positions after expansion, wait for liquidity hunt and lower time frame confirmation.
Before placing any trade, it’s important to understand currency values. This Currency Converter lets you quickly convert currencies using live exchange rates.
 GBPUSD CHART
 How can we use IPDA to trade ?
Once we understand the price movement sequence we can expect price behaviour after identifying in which stage currently we are in .
We know buying and selling starts with CONSOLIDATION. After consolidation price expands , price does not go reverse or into retracement after consolidation. Price can go into expansion only.
Retracement or Reversal?
Everything starts with:
- Consolidation
Consolidation
Expansion
- Expansion
Retracement
Reversal
- Retracement
Expansion
Reversal
- Reversal
Expansion
- Expansion
Consolidation
 After expansion price reverse inform of retracement or reversal. Our duty is to identify whether this is Retracement or Reversal.
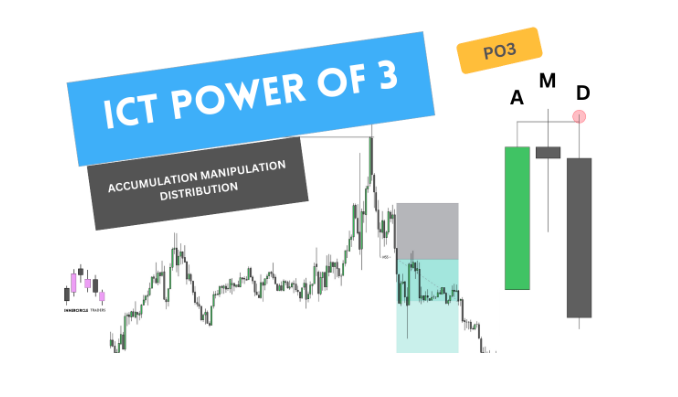
Price can expand, take retailers out then completely reverse. This is the concept we will discuss in detail in upcoming chapters called PO3 or AMD.
Price can expand and reverse to fill FVG’s or rebalance the price ( equilibrium ) then move again toward expansion’s direction.

Hint : To identify expansion : retracement or reversal you need to develop Daily BIAS ( your target or market direction )