Liquidity is the most fundamental aspect in markets. Liquidity is a burning fuel for prices to move. Prices move from high to low or sideways but the sole purpose is to hunt liquidity.
In finance, liquidity suggests any Asset which can easily transform into cash. Markets are cash abundance. Retail traders and smart money put on their orders which eventually brings cash in the market and makes it liquidate.
PRIMARY OBJECT IS TO MAKE MONEY:
Whoever comes in the market and puts on trade , comes with the sole purpose, to make money. The market does not generate money on its own but it distributes money from winner to loser.
In the Markets there is always a buyer for a seller so it’s a distribution of money. Orders from all traders are the liquidity which is meant to be hunted in the market.
If you want to know exactly when the London, New York, Tokyo, and Sydney sessions open in your local time, this Forex Market Hours tool makes it simple and accurate.
What is DRAW ON LIQUIDITY (DOL)?
In our prior articles we discuss a little about liquidity. Now we are going to discuss DRAW ON LIQUIDITY. Since we know price moves for the sake of hunting liquidity all the pending orders in the market.
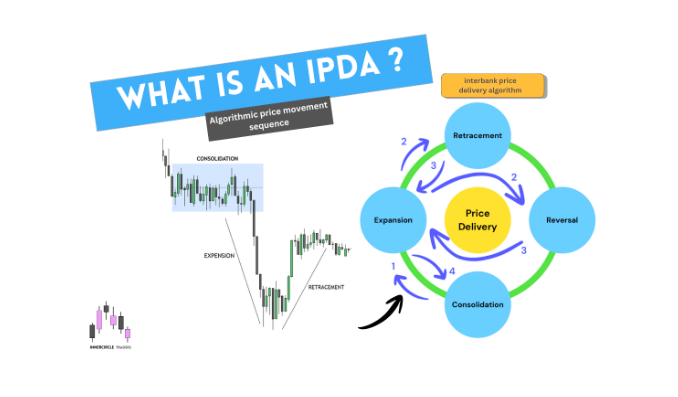
We also know price moves to hunt liquidity , to fulfill inefficiencies (FAIR VALUE GAPS) and from one swing point to another swing points.
Draw on liquidity in ICT concepts are the potential targets which a trader assumes the market should meet.
Before putting on a trader a trader has to define its target first without target it’s blind folded to trade in the markets.
A trader with his analytical skills finds out his potential targets according to his BIAS (BIAS will discuss in next article). Since we know a time is fractal so this draw on liquidity can be ascertained on any time frame in the market.
What can be our DRAW ON LIQUIDITY ON CHARTS?
ICT suggests draw on liquidity can be Internal range liquidity (IRL), external range liquidity(ERL), EQUAL HIGHS AND EQUAL LOWS , SMOOTH AREAS ON CHARTS, LOW RESISTANCE LIQUIDITY RUN (LRLR) ANY FAIR VALUE GAP , FAILURE SWINGS.
Proper risk management starts with position sizing. This Position Size Calculator helps you calculate the exact lot size based on your risk percentage and stop loss.
How can we use Internal Range liquidity and external range liquidity as our DOL (target)?
The relationship between internal range liquidity (IRL) and external range liquidity (ERL) is a core point of ICT concepts. By combining these liquidity models traders can understand the narrative and price potential targets.
IRL–ERL relationship, show how it guides market structure and price targets. Price moves from internal to external liquidity as we know liquidity hunting is the primary object in markets.
If any internal liquidity remains untouched on our charts price this internal liquidity helps traders to frame their targets.
UNDERSTANDING IRL-ERL RELATIONSHIP TO DETERMINE OUR DOL

What is Internal Range Liquidity (IRL)?
Internal range liquidity is represented by fair value gaps (FVGs) within a range.
- A bullish FVG shows an imbalance where price moved aggressively higher.
- A bearish FVG highlights inefficiency where price moved aggressively lower.
What is External Range Liquidity (ERL)?
External range liquidity is simply swing points : swing highs and swing lows.
- A sweep of a swing low represents a purge of sell-side liquidity
- A sweep of a swing high clears buy-side liquidity
These liquidity pools act as magnets for price, providing clear targets. Before placing any trade, it’s important to understand currency values. This Currency Converter lets you quickly convert currencies using live exchange rates.
The Relationship Between IRL and ERL
Markets often move between these liquidity areas from IRL to ERL.
- After sweeping ERL, price typically retraces into IRL (a FVG)
- From IRL, the next target is often the opposite side’s ERL

This IRL to ERL is the easiest way to find our draw on liquidity because prices often remain in this cycle from IRL to ERL. After hunting liquidity from swings point prices usually take retracement to fill fair value gaps . So it’s easy for traders to predict the next target once they find a price at a certain level.
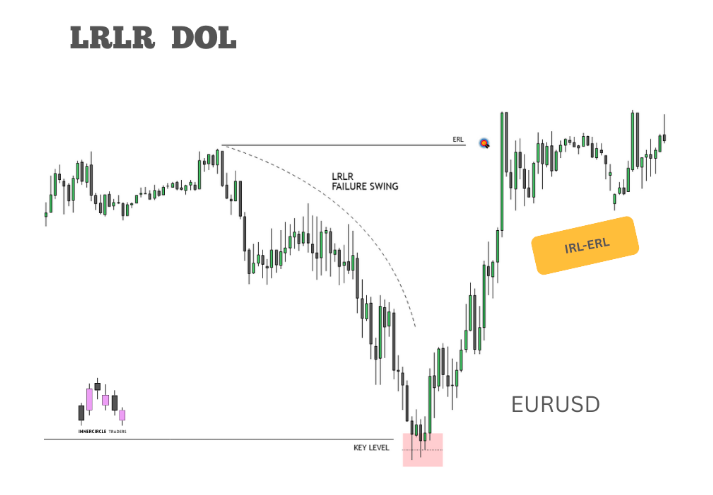
LOW RESISTANCE LIQUIDITY(LRLR) RUN AS OUR DOL
Low resistance liquidity run is the failure swing. When price failed to get high or low of previous swing it made an untouched liquidity level which can potentially be drawn on liquidity.
This swing is also called a failure swing. This level is vulnerable for price to hunt later. This is a form of Liquidity that forms when price creates a failure swing (swing highs or lows left unswept).

LRLR is easy for price to target because liquidity is left behind without being cleared. It often acts as a magnet for price in future moves.
It’s like unfinished business to fulfill later in the form of a liquidity hunt so this can be our easy target or DOL.
EQUAL HIGH AND LOWS ON CHARTS AS OUR DRAW ON LIQUIDITY
When price makes two different swing points relatively equal to each other these swing points are called EQUAL HIGH AND EQUAL LOWS. This is an easy target for price to hunt.
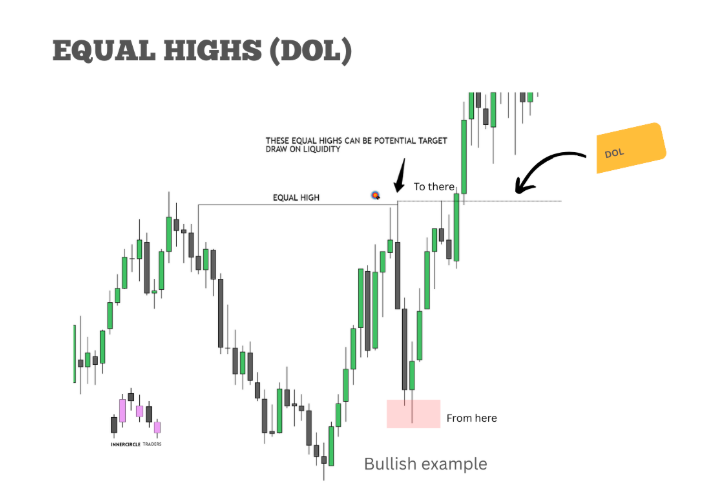
Traders use these equal highs and equal lows as their potential targets. Retail traders often assume these equal highs and lows as resistance or support level so they put their stop loss or orders above these swings. Price would love to hunt these smooth areas. So ICT suggest these equal high or lows
WHAT IS AN IMPORTANCE OF DRAW ON LIQUIDITY ?
This is the most important concept. Without mapping our target we can blindly put our trades in no directions which leads to unnecessary losses.
Draw on liquidity can help traders to align trades with flow of the market. Once a trader finds the most likely price target he can align his trade with the direction of price movement.
EURUSD CHART EXAMPLE